Posted in economics

Indian Economy Poised to Grow at 9.2% in FY22

Dr Debesh Roy, Chairman, InsPIRE

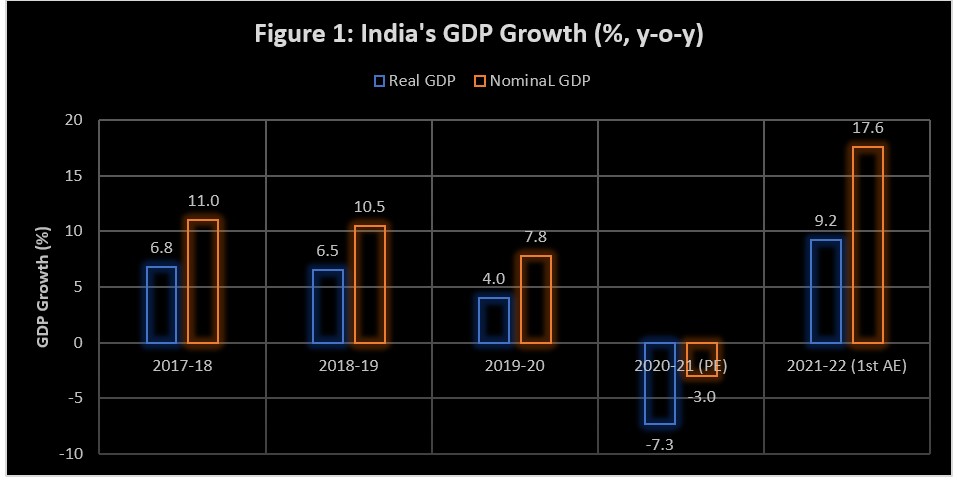
The Indian economy is poised to grow at 9.2% in FY22 (Figure 1) as per the First Advance Estimate of the country’s Gross Domestic Product (GDP) (at 2011-12 prices) estimated by the National Statistical Office (NSO), Ministry of Statistics and Programme Implementation (MoSPI), Government of India. This is against a pandemic-induced contraction of 7.3% suffered by the economy in FY21. The real GDP is estimated to increase by 1.3% over that of the pre-pandemic year (FY20).

It is pertinent to note is that, notwithstanding a favourable base effect, the economy is set to record a higher GDP compared to the pre-pandemic year FY20, due to favourable policy environment, resulting in a positive investment growth, as reflected in the Gross Fixed Capital Formation (GFCF).

The nominal GDP is set to grow at a robust 17.6% in FY 22, compared to -3.0% in FY 21. The FY22 nominal GDP, estimated at INR 232.15 trillion (USD 3.12 trillion) is expected to be 14.1% higher than that of the pre-pandemic year (FY20) at INR 203.51 trillion (USD 2.74 trillion).   The economy which was on a decelerating mode during the three pre-pandemic years, (real GDP growth at 6.8%, 6.5% and 4.0% respectively during FY18, FY19 and FY20 and nominal GDP growth at 11.0%, 10.5% and 7.8%, respectively), is set to achieve a robust growth 9.2% (real GDP) and 17.6% (nominal GDP) in FY22 (Figure 1).

Source: MoSPI, GoI

The real Gross Value Added (GVA) in FY22 is estimated to grow at 8.6% (Table 1). The GVA data reveals that all sectors of the economy except ‘trade, hotels, transport, communication and services related to broadcasting’ (which are still 8% below the pre-pandemic level) reached the pre-pandemic level (on constant prices).

The agriculture sector, which was the only sector unaffected by the pandemic in terms of real GVA growth in FY21, is estimated to grow steadily at 3.9%, compared to 3.6% in the previous year and 4.3% in FY20. The industrial sector is expected to achieve a robust recovery, with manufacturing; mining and quarrying; electricity, gas and water supply; and construction, set to grow at 12.5%, 14.3%, 8.5% and 10.7%, respectively (Table 1).  Under the services sector, trade, hotels, transport, communication and services related to broadcasting, which was the hardest hit during the pandemic is estimated to grow at a robust 11.9%. However, financial, real estate, and professional services, etc. is estimated to grow at a less impressive 4.0%. Public administration, defence, etc. is estimated to grow at 8.6% (Table 1).

Source: MoSPI, GoI

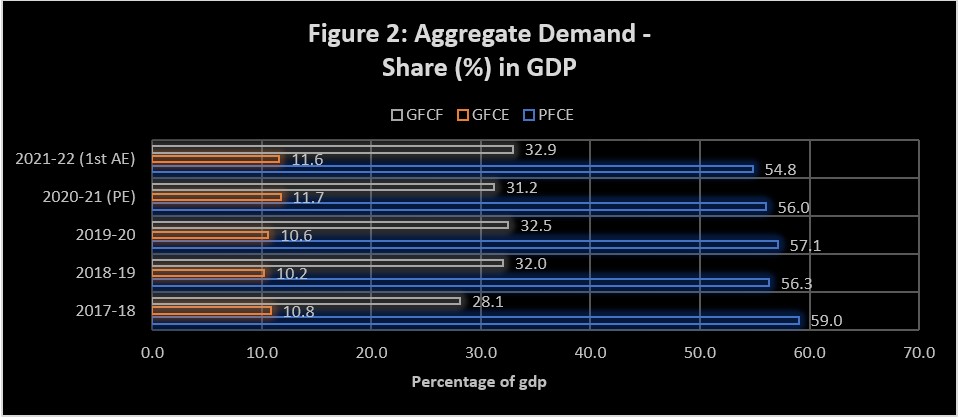
On the expenditure side, Private Final Consumption Expenditure (PFCE) is still 3% below the pre-pandemic level, and its share in GDP is observed to be on a declining trend from 57.1% in FY20, to 56% in FY 21 and further down to 54.8% in FY22 (Figure 2). This is a cause for concern as India’s growth story has essentially been a consumption led one. Loss of lives, livelihoods, jobs and income caused by the pandemic have depressed private consumption.

Another concern is the decline in the share of Government Final Consumption Expenditure (GFCE) in GDP, from 11.7% (FY21) to 11.6% (FY22) (Figure 2). A steady and sustainable growth in GDP can be sustained with a higher share of GFCE, as it crowds in private investment.  While fiscal consolidation is of prime importance for attaining high, steady and sustainable growth, it is imperative to recalibrate the same to address the serious impact of the pandemic on the economy.

According to research by SBI (Ecowrap, 07 Jan, 2022), “taking into account the revised GDP figures of today, even if we consider the additional spending announced by the Government in early December 2021 fiscal deficit of the Government still comes at INR 15.88 trillion (USD 0.21 trillion) or 6.8% of the GDP. For FY23, the fiscal consolidation should remain limited to 30-40 bps from the current fiscal”.

A silver lining in the expenditure side is the increase in the share of Gross Fixed Capital Formation (GFCF) in GDP to 32.9% in FY22 (Figure 2), the highest level in the last five years. The primary driver for higher GFCF is the investments made to meet the growing pent-up demand in the economy. The focus of GoI on investment in infrastructure and the Performance Linked Incentive (PLI) Scheme, should lead to accelerated growth in investments, leading to a higher and more sustainable growth in GDP.  

Source: MoSPI, GoI

According to the NSO, the First Advance Estimates (FAE) of GDP, introduced in 2016-17 to serve as essential inputs to the Budget exercise, is based on limited data and compiled using the Benchmark-Indicator method i.e., the estimates available for the previous year (2020-21 in this case) are extrapolated using relevant indicators reflecting the performance of sectors.

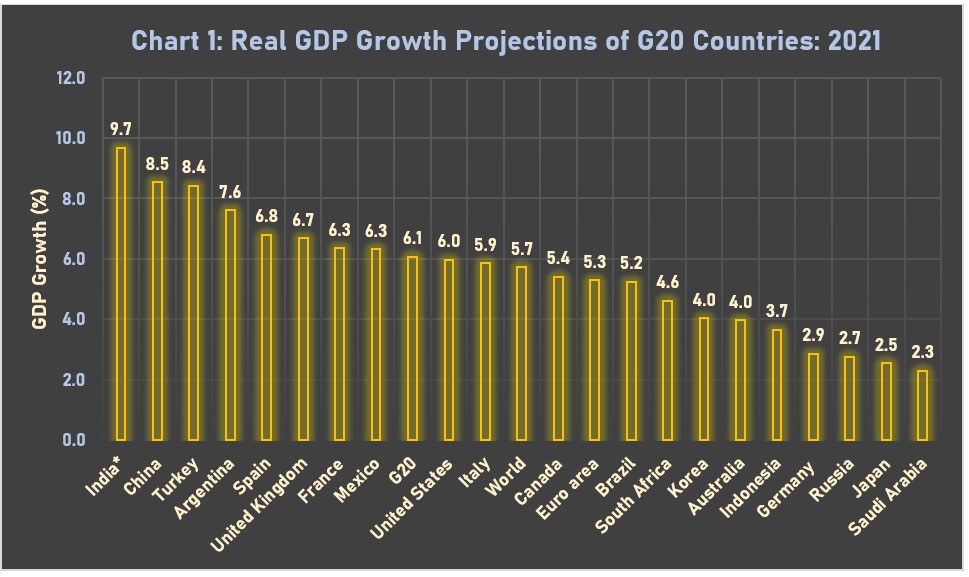
While there could be some amount of under- or over-estimation of GDP in the FAE, the subsequent estimations, could be within 20-30 basis points, on either side. There could possibly be an upward bias in the revised estimates for FY22. However, it again depends on the impact of the prevailing omicron variant OF Covid-19 on contact-intensive sectors of the economy. Nevertheless, SBI has stuck to its estimate of 9.5% growth in FY22. Earlier estimates by RBI and IMF also point to a 9.5% growth for the Indian economy, while OECD’s estimate is a tad lower at 9.4%, which would still be higher than the growth estimates for China at 8% (IMF) and 8.1% (OECD), making India the fastest growing large economy in the world.

Posted in economics

Status of Inflation in India – September 2021

Dr Debesh Roy, Chairman, InsPIRE

Retail Inflation

India’s Consumer Price Index (CPI) inflation fell sharply from 5.3% in August 2021 to  4.35% in September 2021, coming closer to RBI’s medium-term inflation target of 4%, and continuing its declining trend for the fourth consecutive month (Figure 1). A sharp decline in food inflation was primarily responsible for the decline in general inflation. While rural inflation dropped to 4.13% in September from 5.28% in the previous month, urban inflation declined from 5.32% to 4.57%. The retail inflation trend for the first half of FY22 reveals a sharp rise from 4.23% in April to 6.3% in May, before tapering to 6.26% and 5.59% in June and July, respectively.

The RBI in its latest Monetary Policy on 8 October 2021 had sharply reduced the outlook for CPI inflation during FY22 from 5.7% projected in the previous MPC meeting (04-06 August 2021) to 5.3%. However, the IMF in its October 2021 issue of World Economic Outlook raised its inflation projection for India from 4.9% estimated in April to 5.6%, citing growing worldwide inflationary risks.  

Source: MOSPI, GoI

The main cause for the decline in retail inflation in September is the sharp easing of food inflation (Figure 2). The Consumer Food Price Inflation (CFPI) declined steadily from 5.15% in June 2021 to 3.96% in July and 3.11% in August, before it fell sharply to 0.68% in September. Sharp decline in inflation was observed in respect of vegetables (-11.68% to -22.47%) and eggs (16.33% to 7.06%). Inflation for cereals continued to be  negative at -0.61%. However, inflation for edible oils (34.19%) and non-alcoholic beverages (12.99%), remained elevated.

Fuel inflation increased from 12.95% to 13.63%, due to continuous rise in international crude oil prices. Core inflation, which excludes food and fuel prices, however, rose from 5.5% in August to 5.8% in September.

Source: MOSPI, GoI

Further easing of food inflation in the coming months due to good kharif harvest, and favourable base effect, will keep inflation benign. This would give enough leeway to the RBI to continue with the accommodative stance, at least till April 2022 monetary policy review. However, inflation risks remain high due to elevated international commodity prices, including crude oil prices. Further, price pressures could intensify due to the second-round effects of high fuel costs, resulting in higher prices of other goods, after a time lag.

Wholesale Inflation

India’s WPI inflation declined to 10.66% in September, the lowest in six months,   from 11.39% in August (Figure 3). However, the continued high WPI inflation was on account of high inflation of manufactured products (weight of 64.2%) in May, June, July, August and September at 11.25% 10.96%, 11.2%, 11.39% and 11.41%, respectively.

It is evident that cost push pressures are gradually seeping into prices of manufactured goods, due to increase in manufacturing activities in the post-pandemic situation. The highest inflation was observed in case of crude petroleum and natural gas at 59.5%, 46.97%, 40.28%, 40.03% and 43.92%, respectively, during the last five months, due to steady increase in the international price of crude oil.

Fuel and power inflation at 36.74%, 29.32%, 26.02%, 26.09% and 24.81 respectively   in May, June, July, August and September. The decline in WPI inflation was due to reduction in food inflation from -1.29% in August to -4.69% in September, 2021.

Price volatility in the international markets for crude oil and rising prices of edible oils and metal products would lead to further rise in WPI inflation, considering the fact that India is a price taker for most of these commodities.

Source: Office of the Economic Adviser, Ministry of Commerce and Industry, GoI

There continues to be a divergence between CPI and WPI inflation (Figure 4) because of the nature of the price indices and higher weighting of food items in CPI (47.25% against 15.26% for WPI) and that of manufactured items in WPI (64.23%).

Source: MOSPI, GoI and Office of the Economic Adviser, Ministry of Commerce and Industry, GoI
Posted in economics

Strong Global Recovery on the Cards: India Set to Regain its Numero Uno Position

Bijetri Roy, Managing Director & Chief Strategy Officer, InsPIRE

The OECD, in its interim report for September 2021, has projected a strong, but uneven global growth in the years 2021 and 2022 (Charts 1 and 2). Government and central bank support and progress in vaccination would lead to growth above the pre-pandemic level. With countries emerging from the crisis facing different challenges, the growth would remain uneven.

Wide differences in vaccination rates between countries and emergence of new variants of the virus have restricted the opening up of economies and affected the supply chains. Output and employment gaps continue in many countries, especially in emerging-market and developing economies (EMDEs), where vaccination rates are low.

Estimates by OECD indicate that global GDP would grow at  5.7% in 2021 (Chart 1), followed by 4.5% in 2022 (Chart 2). The GDP has now surpassed its pre-pandemic level, but output in mid-2021 was still 3.5% below the projection made before the pandemic. This indicates  a real income shortfall of over $ 4.5 trillion (in 2015 PPPs). It is, therefore, imperative to close this gap to minimise long-term damage to the global economy from the pandemic through job and income losses.

G20 countries are expected to grow at 6.1% in 2021 (Chart 1) and 4.1% in 2022 (Chart 2), mainly driven by high growth in India (9.7%), China (8.5%), Turkey (8.4%), and Argentina (7.6%) in 2021. The year 2022 could witness a slower, although a stable growth due to pick up in investments and consumption, without the benefit of base effect. Growth in GDP in 2022 is expected to be influenced by India (7.9%), Spain (6.6%) and China (5.8%).

As indicated by high-frequency activity indicators, such as the Google location-based measures of retail and recreation mobility, global activity continued to strengthen in recent months, helped by improvements in Europe and a strong rebound in India and Latin American countries.  

India is set to regain its position as the fastest growing economy in the world.  According to OECD, India is expected to grow at a real GDP of 9.7% in 2021-22 (Chart 1), albeit from a low base. However, the Indian economy is expected to get on track to a long-term high growth trajectory, with a brisk growth of 7.9% in 2022-23 (Chart 2).

The Q1 (April-June 2021) GDP figures, the latest core sector growth data and recent positive high frequency activity data, indicate that the economy is gaining traction. Standard & Poor’s has also highlighted in a recent Asia Pacific report that India’s growth in GDP would  make a strong rebound in the July-September 2021 quarter, but warned against the impact of faster than expected tapering by the US Federal Reserve, causing capital flow risks as monetary policy by Reserve Bank of India (RBI) remains accommodative with real rate of interest in negative territory.

However, tapering by US Federal Reserve is expected to be gradual and EMDEs like India may not face an adverse situation similar to the taper tantrum of 2013. Moreover, India’s economic fundamentals are getting stronger, and the country could grow at a faster and more sustainable rate.

The Chinese economy is showing signs of a slowdown in economic growth. Troubles are brewing in the real estate and energy sectors in China. The country is facing an energy crunch due to shortages of coal for power generation, forcing it to increase purchase of natural gas. China’s power demand increased by 15% during the current year, but its domestic supply of coal – the largest source of power generation in the country – grew by just 5%. The Evergrande crisis has shown the fragility of the real estate sector in the country. If that is not all, the Chinese government’s recent crackdown on large corporations could impact investment and growth adversely.

*India’s data is for the  fiscal year 2021-22 
Source: OECD Economic Outlook, Interim Report September 2021
*India’s data is for the fiscal year 2022-23 
Source: OECD Economic Outlook, Interim Report September 2021.

The global economy continues to be in a state of flux. There is ample evidence to suggest that the supply shock reverberating around the world, combined with outbreaks of the Delta variant of corona virus, is tempering the recovery in growth. Results of business surveys from the US, UK and Eurozone suggest that economic activities have slowed down as delivery times grew longer and backlogs built up.

Policy Measures to Support Global Growth Prescribed by OECD

Governments need to ensure deployment of all resources necessary to accelerate vaccinations throughout the world to save lives, preserve incomes and control the virus. Also, there is need for stronger international efforts to support vaccinations in low-income countries.

Continuance of macroeconomic policy support, with the mix of policies contingent on economic developments in each country.

Maintenance of accommodative monetary policy, with a clear guidance about the horizon and extent to which any inflation overshooting will be tolerated.  Also, there needs to be a clear  roadmap towards normalisation of monetary policy.

Fiscal policies should remain flexible and contingent on the state of the economy.

Credible fiscal frameworks that provide clear guidance about the medium-term path towards debt sustainability, and likely policy changes along that path, to help maintain confidence and enhance the transparency of budgetary choices.

There is a need for stronger public investment and enhanced structural reforms for boosting resilience, and improving the prospects for sustainable and equitable growth.

Posted in economics

Brisk Core Sector Output Growth in August 2021

Dr Debesh Roy, Chairman, InsPIRE

India’s eight core industries witnessed a brisk 11.6% growth in output in August 2021, compared with 9.9% in the previous month, and 9.3% in June 2021 (Chart 1), in spite of a less beneficial base effect. The sector also witnessed a 3.9% increase from the pre-Covid level of August 2019. However, the overall output was still lower by 0.3 per cent when compared to the February 2020 level.

During the period August 2020 to February 2021, the growth remained negative or very low, ranging between (-) 6.9% (August 2020) and 1.3% (January 2021), due to fall in consumption and investment demand on account of the impact of country-wide lockdown and slow opening up of the economic sectors. The growth rose sharply to 12.6% in March 2021 and  62.6% in April 2021, mainly due to low base effect.  The growth moderated to 16.4% in May 2021 (Chart 1).

Source of data: Press Release dated September 30, 2021, Office of the Economic Adviser, Department of Promotion of Industry & Internal Trade, GoI

The core sector growth in August 2021 was mainly driven by cement at 36.3% (compared to 21.7% in July and 7.5% in June 2021), natural gas at 20.6% (compared to 19% in July and 20.6% in June 2021), coal at 20.6% (compared to 18.8% in July and 7.4% in June 2021), electricity at 15.3% (compared to 11% in July and 8,2% in Junto e 2021), and refinery products at 9.1% (compared to 6.7% in July and 2.4% in June 2021) (Chart 2).  The steel sector, however,  witnessed a steady slide in growth from 24.9% in June 2021 to 9.4% in July 2021 and 5.1% in June 2021. But, fertilizers (-3.1%) and crude oil sectors (-2.3%) suffered decline in August 2021.

The high core sector output growth in August 2021 possibly reflects the beginning of a period of a more elevated and sustainable growth trajectory of the core industries, due to higher growth in the economic sectors and the thrust of the government on investment in infrastructure as per the National Infrastructure Pipeline. Weak monsoon rains in August positively impacted the output for coal, cement and electricity. Also, it influenced the increase in  mobility that resulted in the growth in petroleum refinery products. However, excess rainfall during September could have an adverse impact on the growth of output in these sectors. Therefore, according to ICRA, core sector output in September may not be sustained, and  could fall sharply to 4-6%.

Source of data: Press Release dated September 30, 2021, Office of the Economic Adviser, Department of Promotion of Industry & Internal Trade, GoI
Posted in economics, Financial Markets

US Federal Reserve Prepares to Taper in November

Dr Debesh Roy, Chairman, InsPIRE

The Federal Open Market Committee (FOMC) at its meeting held on 22 September 2021, unanimously decided to maintain the rate of interest paid on reserve balances at 0.15% and also to continue with the federal funds rate in a target range of 0-0.25%, continuing with the accommodative stance.  While the FOMC decided for now to continue with quantitative easing (QE) of $120 bn-a-month asset purchase program, the Fed Chair Mr. Jerome Powell made it amply clear that “tapering” of the program could be initiated at the next FOMC meeting in November 2021.

The stimulus package was introduced at the onset of the pandemic, and the US Federal Reserve pledged to maintain it until there was substantial progress on its dual goals of average 2% inflation and maximum employment. The Fed believes that the US economy would be on a firm footing on these two counts, and would, therefore start the tapering exercise. Mr. Powell also revealed that the FOMC broadly supports a gradual tapering and intends to withdraw the stimulus entirely around the second half of 2022.

There is however, less unanimity among Fed members regarding tightening of interest rates, as the eighteen-member Committee is now evenly split on the prospects of a rate increase in 2022. There could be three rate hikes by the end of 2023.

Impact of Taper Decision by US Fed on Emerging Market and Developing Economies (EMDEs) like India

Financial markets globally, including India’s seem to have factored in the imminent gradual tapering exercise by the US Federal Reserve. Indian markets continued to surge, in spite of the almost certain tapering from November 2021. QEs with near zero interest rates in developed countries, led to massive flow of funds to emerging market economies.

The 2013 tapering by US Fed in the aftermath of the Global Financial Crisis, led to what is known as “taper tantrum”. In response to the statement by the then Fed Chair Dr. Ben Bernanke in May 2013, suggesting that the FOMC might soon start to slow down its bond purchases, the US 10-year bond yield surged and triggered a wave of capital flight from emerging economies. The countries affected the most from the “taper tantrum” were South Africa, Brazil, India, Indonesia and Turkey, which were dubbed the “fragile five” by Morgan Stanley due to their high current account deficits and dependence on inflows of foreign capital.

However, the situation is vastly different now, and “taper tantrum” can be ruled out in India. Foreign Institutional Investors (FIIs) have invested $8.94 billion in India so far in 2021. The Sensex and Nifty have gained 23-25% during the year. The effect of the tapering would be relatively low for India’s markets due to strong fundamentals, with a low current account deficit and a high and steadily growing foreign exchange reserves, which have touched a comfortable $640 billion (as on 17 September 2021). While high inflation is a problem, it is transient in nature, as underscored by the Reserve Bank of India.  

The EMDEs must certainly remain vigilant and take necessary monetary and fiscal measures to prevent taper to turn into a “tantrum” to cause any major outflow of liquidity from these economies.

Posted in agriculture, economics

Oilseeds and Commercial Crop Production in India – Kharif 2021-22

Dr Debesh Roy, Chairman, InsPIRE

The estimated production of oilseeds is set to decline by -1.4% to 233.9 lakh tonnes (LT) in Kharif 2021-22, from 240.3 LT in 2020-21, due to a decline in acreage by -1.3% (Table 1 and Chart 1). The five-year CAGR of oilseeds production is estimated to be 3.7%. India’s demand for oilseeds is mostly met through imports. Therefore, Government of India’s decision to launch the National Mission on Edible Oils – Oil Palm (NMEO-OP), a Centrally Sponsored Scheme, is expected to significantly increase acreage and output of oilseeds in the country.

Among major oilseeds, groundnut and soyabean are expected to experience decline in output in kharif 2021-22. Groundnut output is estimated to decline by -3.5% to 82.5 LT, due to -3.6% decline in area under cultivation (Table 1 and Chart 1). The five-year CAGR of groundnut production is estimated to be 6.5%. It is estimated that soyabean production would decline by -1.4% to 127.2 LT, although there has been a marginal increase of 0.5% in acreage. Soyabean output would grow at a five-year CAGR of 2.8%.

Commercial crops like sugarcane and cotton are expected to perform better than the previous year. Sugarcane production is estimated to grow at  5% over the previous year to set a record of 4192.5 LT, on account of 1.6% increase in acreage. The output of cotton is expected to increase by 4.4% to 362.2 lakh bales, although there has been a significant decline of -5.8% in the area under cultivation, signifying an improvement in productivity. Finally, the output of Jute and Mesta is expected to decline by -1.1% to 96.1 lakh bales, although there has been an increase of 1% in acreage (Table 1 and Chart 1).

Source: First Advance Estimates of Production of Foodgrains for 2021-22, Ministry of Agriculture
and Farmers’ Welfare, GoI, and calculations by InsPIRE.
Source: Prepared by InsPIRE, based on data accessed from First Advance Estimates of Production of Foodgrains for 2021-22, and Progress Report of Kharif Area Coverage as on 17/09/2021, Ministry of Agriculture and Farmers’ Welfare, GoI.
Posted in agriculture, economics

New Milestone of 150.5 MT Kharif 2021-22 : Estimated Foodgrain Output  

Dr Debesh Roy, Chairman, InsPIRE

India’s foodgrain production for the kharif season 2021-22 is estimated to reach a record 150.5 million tonnes (0.6% increase over 2020-21, albeit a decline in acreage of -0.1%), while growing at a five-year CAGR of 2% (Table 1 and Chart 1). This was mainly on account of increased area under cultivation of rice and pulses (mainly tur or arhar). The estimated increase in acreage under these crops was facilitated by a surge in monsoon rains in September 2021.

The output of kharif rice is estimated to touch a record 107 million tonnes (MT), registering a growth of 2.5% over the previous year (Table 1). However, the area under cultivation of rice has increased marginally by 0.2% over 2020-21 (Chart 1), signifying efficiency gains in the cultivation of the crop. During the last five years, the production of kharif rice has grown at a CAGR of 2.2% (Table 1). Maize, with an estimated output of 21.2 MT, has experienced -0.9% annual change in production, against a 1.6% increase in area, signifying a decline in yield. The five-year CAGR of maize output stood at 2.1%. Nutri/ coarse cereals as a whole have witnessed significant decline in the estimated output by  -6.7% and acreage by -2.3%.

While the estimated output of tur (4.4 MT) increased  by 3.5%, acreage increased by 3.8%. The production during the last five years increased by an impressive CAGR of 3.2%. The estimated output of pulses as a whole (9.5MT), increased significantly by 8.7% over the previous year, while the acreage had increased by 2.1% (Chart 1), indicating an increase in yield, The five-year CAGR of pulses stood at 1% (Table 1).

Source: First Advance Estimates of Production of Foodgrains for 2021-22, Ministry of Agriculture
and Farmers’ Welfare, GoI, and calculations by InsPIRE.
Source: Prepared by InsPIRE, based on data accessed from First Advance Estimates of Production of Foodgrains for 2021-22, and Progress Report of Kharif Area Coverage as on 17/09/2021, Ministry of Agriculture and Farmers’ Welfare, GoI.
Posted in economics, Financial Markets

SENSEX at 60K+ : Hitting the “Bull’s” Eye

Bijetri Roy, Managing Director & Chief Strategy Officer, InsPIRE

SENSEX closed at 60,048.47 on 24th September, 2021, ear-marking a high in the graphs, since the last milestone of 50,255.75 on 3rd February, 2021. In fact, even the BSE Realty and NIFTY IT indices closed at their respective highs of 4002.46 and 37,103.25.

This is a clear indication that India is still the flavour of the season, despite a probable slowdown in China or smaller bond purchase by central banks.

Earlier this week, Sanjeev Prasad, Kotak Institutional Equities said, “We expect a strong economic and earnings revival and a stable COVID-19 situation to provide short-term support to the market. We do not see any change to India’s medium-term narratives, including favourable demographics and likely multi-year investment cycle led by corporate and household capital expenditure.” (Source: Financial Express)

In the last four seasons, Domestic Institutional Investors (DIIs) invested in shares worth USD 1 billion, while Foreign Portfolio Investors (FPIs) invested in Indian equity worth USD 9 billion. (Source: Financial Express)

According to Piyush Garg, Chief Investment Officer at ICICI Securities Ltd, “Indian stocks have been performing well over the past few quarters due to robust liquidty, upward earnings cucle and an economic revival led by a fading pandemic. (Source: Mint Lounge)

Infographic designed by Institute for Pioneering Insightful Research & Edutech Pvt Ltd (InsPIRE)

“SENSEX reaching 60,000 shows India’s growth potential and its emergence as a world leader, amid Covid”, Ashish Chauhan, MD & CEO, BSE.

However, looking at the global markets at present, investors should be cautious of the following:

  • Rising inflation
  • Subsequent squeeze in liquidity

Overall, India is definitely the flavour of the season, having hit the “bull’s” eye with the 60K milestone.

Posted in economics

Evergrande Crisis in China

Bijetri Roy, Managing Director & Chief Strategy Officer, InsPIRE

Crisis ridden Evergrande is one of China’s largest real estate developers and is also the most indebted. The crisis has raised alarm bells across the globe. Financial Times has reported that the company used billions of dollars raised by selling wealth management products to retail investors to plug funding gaps and even to pay back other wealth management investors. It is also reported that Evergrande financial advisers marketed the products widely, including to homeowners in its apartment blocks, while its managers persuaded subordinates to invest.

Evergrande owes money to thousands of retail investors along with banks, suppliers and foreign investors, who fear they will not be repaid if the property group collapses. The Rmb 40 billion of wealth management products of Evergrande is dwarfed by its total of liabilities of Rmb2 trillion (USD 310 billion) (Source: Financial Times).

Evergrande’s total debt exposure (USD 310 billion)  includes USD19 billion in offshore dollar-denominated bonds. The group has expressed that it might default on USD 80 million worth of interest payments due within a week. This would not only  have ripple effects within China but the global economy as well. There are 128 banks and about as many financial institutions have direct exposure to Evergrande. A large number of these institutions could take big hits if the company collapses, sending shock waves across global markets. A tightening of controls by the People’s Bank of China and a weakening of housing demand has resulted in this crisis.

There is a view among a section of experts that the crisis is reminiscent of the Lehman crisis of the US in 2008, which triggered the Global Financial Crisis. However, a contrarian viewpoint is gaining support. According to a team at Barclays led by Ajay Rajadhyaksha, the two crises could not be more different. They argued: “the property sectors’ linkages to the financial system are not on the same scale as a large investment bank, but the debt capital markets are not the only, or even the primary, means of funding. China is to a large extent, a command-and-control economy. In an extreme scenario, even if the capital  markets are shut to all Chinese property firms, regulators could direct banks to lend to such firms, keeping them afloat and providing time for an extended ‘work-out’ if needed.

The only way to get a widespread lenders’ strike in a strategically important part of the economy would be if there were a policy mistake, where the authorities allow the chips to fall where they may (perhaps to impose market discipline), regardless of the systemic implications. And we think that’s very unlikely; the lesson from Lehman was that moral hazard needs to take a back seat to systemic risk. We don’t mean to imply that China has succeeded in suspending the laws of economics. If an asset can’t fully service the underlying debt, it of course matters. But the economics can show up through either a one-time (violent) balance sheet adjustment – aka a financial crisis – or through many quarters of income statements (a debt bubble being deflated).

We also don’t mean to suggest that China could never have a Lehman moment. But with the banking system likely to be pressed into service as a funding source in the event of real stress, China would likely face a ‘true’ financial crisis only if its banks had funding problems. This risk was high in 2015, when the country saw over a trillion dollars of capital flight, meaning there was something of a ‘run’ on the domestic financial markets as a whole”. (Source: Financial Times).

Posted in economics

National Asset Reconstruction Company Ltd (NARCL)

Dr Debesh Roy, Chairman, InsPIRE

The Union Finance Minister Ms. Nirmala Sitharaman on 16 September 2021 announced that the Reconstruction Company Ltd (NARCL) would be operational soon. The NARCL would ensure resolving bad loans within five years, beyond which the guarantee to be issued by the government would expire.

The Union Cabinet had on 15 September 2021 approved a government guarantee of INR 306 billion (USD 4.15 billion) to be provided for the security receipts issued by the NARCL to buy bad loans of banks. The FM has stated that  in many cases, the guarantee need not be invoked as it is reasonable to expect that realization in many cases will be more than the acquisition cost.

The NARCL would acquire assets by making an offer to the lead bank.  Once the offer is accepted, India Debt Resolution Company (IDRC), in which PSBs will hold up to 49% stake, will be engaged for management and value addition. The NARCL would  resolve stressed loans above INR 5 billion (USD 0.07 billion) each, amounting to about INR 2 trillion (USD 21.14 billion) in phases.

These stressed assets would be acquired by NARCL by paying 15% cash to lenders and the remaining 85% would be paid through security receipts, backed by government guarantee. These security receipts will be tradeable. Fully provisioned assets of INR900 billion are to be transferred to NARCL in the first phase. The new framework will facilitate the freeing up of  banking personnel  to focus on increasing business and credit growth.

A government guarantee can be invoked to cover the shortfall between the amount realised from the underlying assets and the face value of the security receipts issued for such assets, subject to an overall ceiling of INR 306 billion (USD 4.15 billion). The condition for invoking the guarantee will be either resolution or liquidation.

A major concern is that a proper market for impaired assets is yet to develop in India.  However, the new mechanism could allow market-driven payment flexibility by adopting newly-devised auction formats.